Custom Timings in Viva Copilot reports
In Viva Insights, you can set up 2 Copilot reports; Adoption and Impact.
I’ve created a custom report, that you can download from here, where you can change the time settings manually for the Impact report! This blog post is split into these sections, so feel free to scroll to whatever seems most interesting to you.
- The standard report from Microsoft and Hours calculations
- Using my template
- Technical under-the-hood information on the template
Please bear in mind that this is not the Microsoft official recommendation and that the standard report is reflecting the calculations based on their findings. Use this report at your own caution.
The standard report from Microsoft and Hours calculations
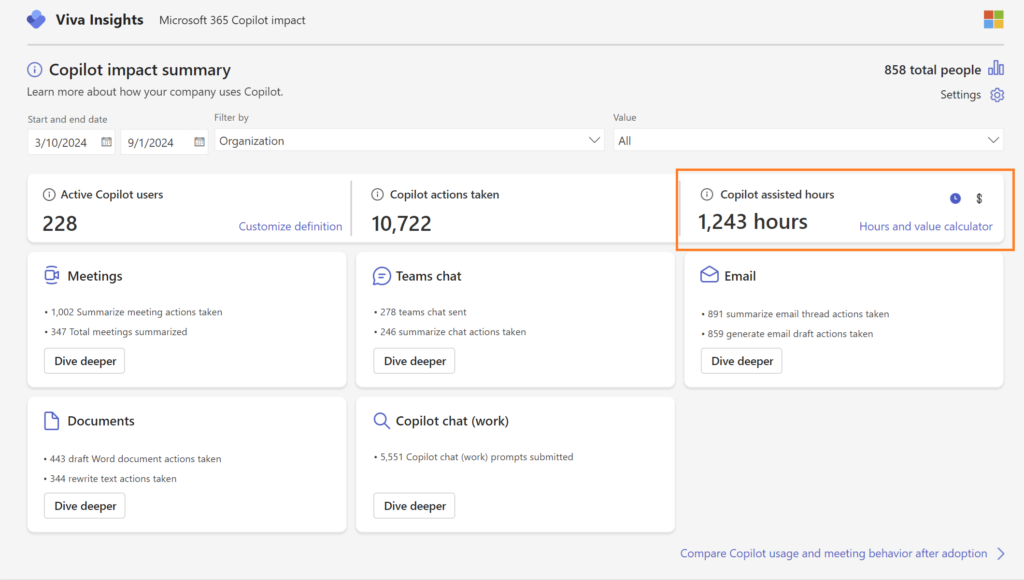
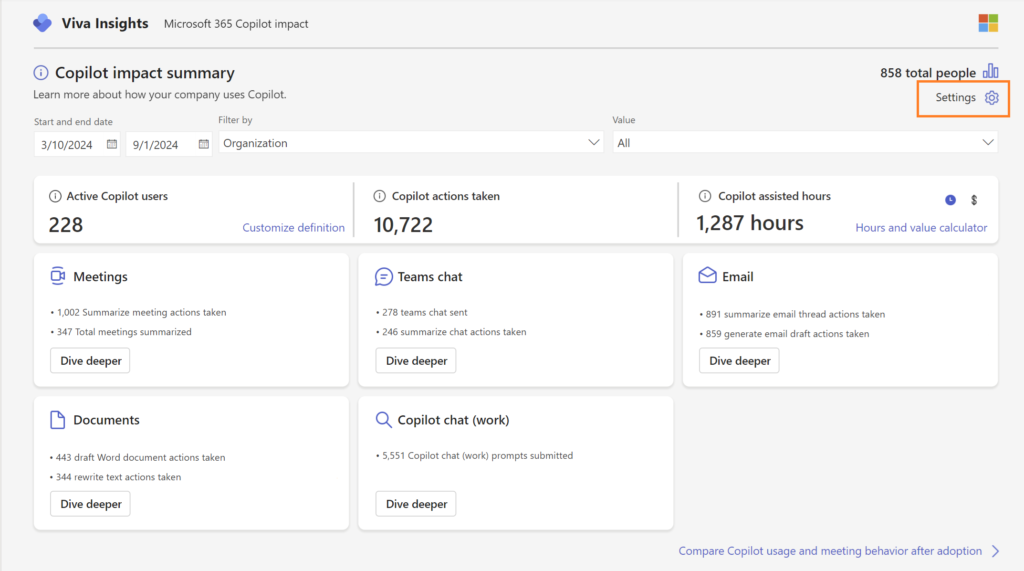
In the Impact template, on the very first page, you’re presented with this value regarding Copilot assisted hours:
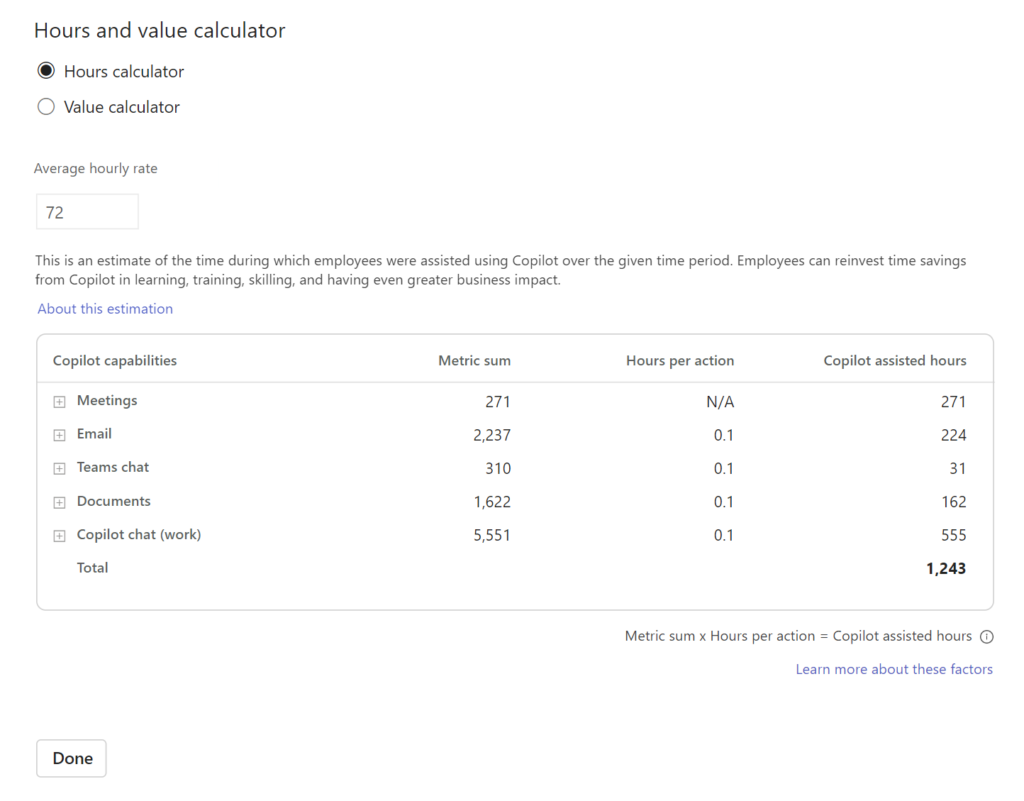
Clicking on the Hours and Value Calculator will bring you to a page that looks like this. Note that all the “Hours per action” is always 0.1, i.e. 6 minutes.
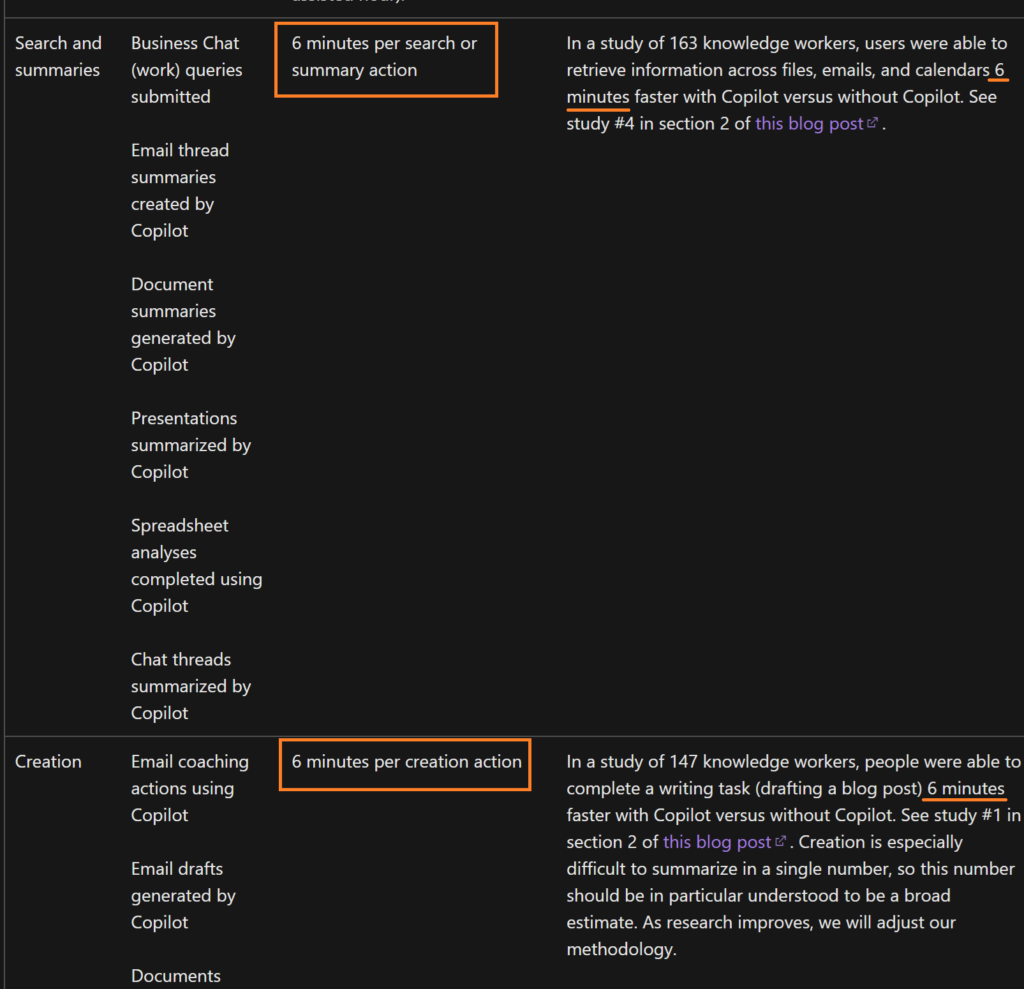
There’s a link named “About this estimation” that will take you to this page where we can learn that 2 studies found that people where roughly 6 minutes faster when using Copilot compared to not using Copilot.
We’re also referred further to a blog post with more details on that study. You can find it here:
https://www.microsoft.com/en-us/worklab/work-trend-index/copilots-earliest-users-teach-us-about-generative-ai-at-work
The section they mention looks like this:
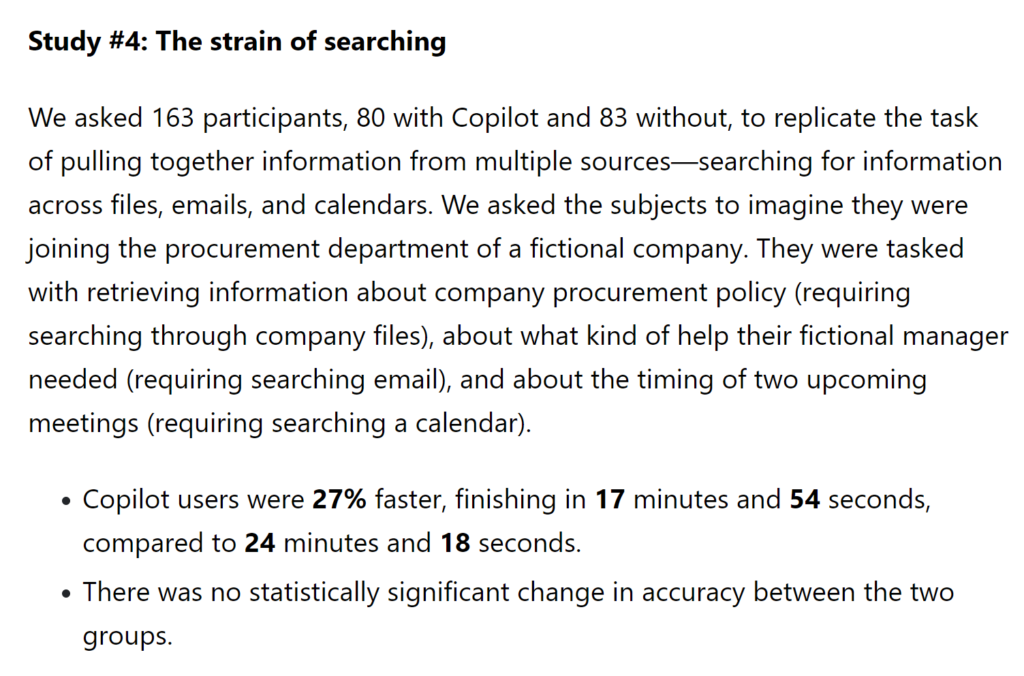
Aha! The time difference is not just roughly 6 minutes but rather specifically 6 minutes and 24 seconds. Oh if there was only some way you could apply these granular settings in the Impact report..
Using my template
Download a copy of the PBIT file from my GitHub here.
Set up everything according to the normal procedure for the Copilot Power BI Template except for the steps where you open the PBIT file from Viva Insights. Use the same source link from Viva to connect to the template as if you where using the built in one.
When you open the report, you have a cog wheel for settings over here. Click on it to head into the Reports settings page.
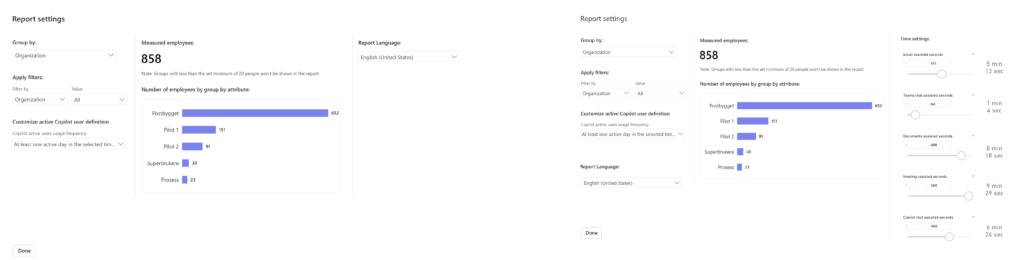
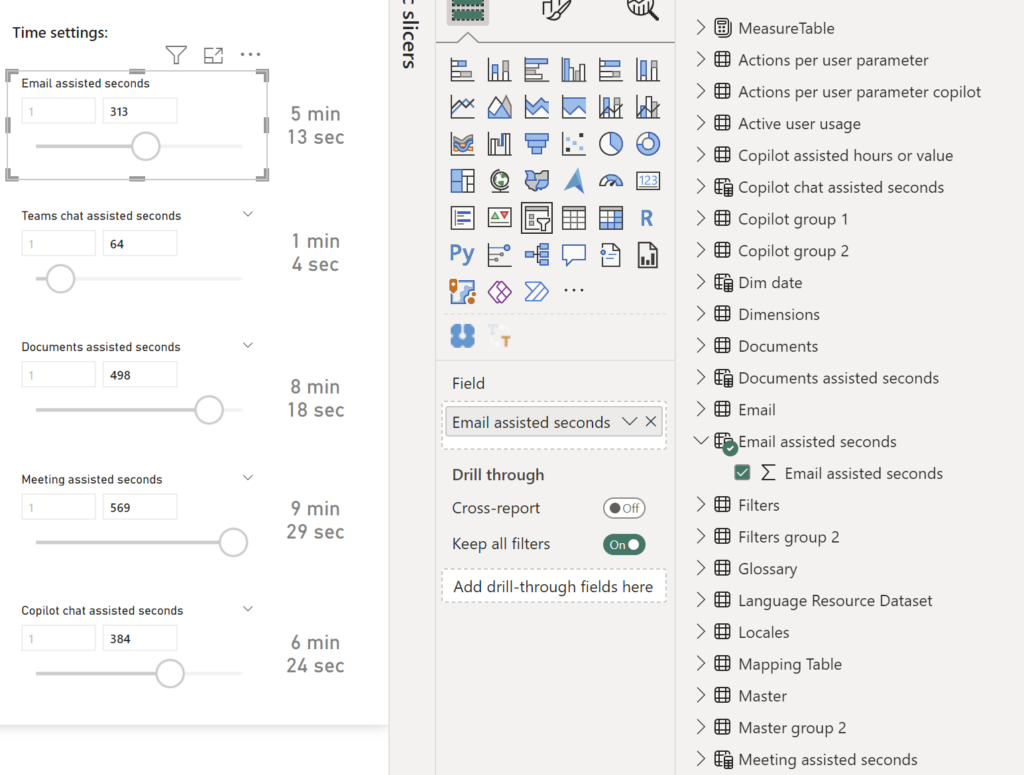
On the Settings page, I’ve moved the language option as well as added slicers for timings on the right side. Here’s a comparison of the setting pages.
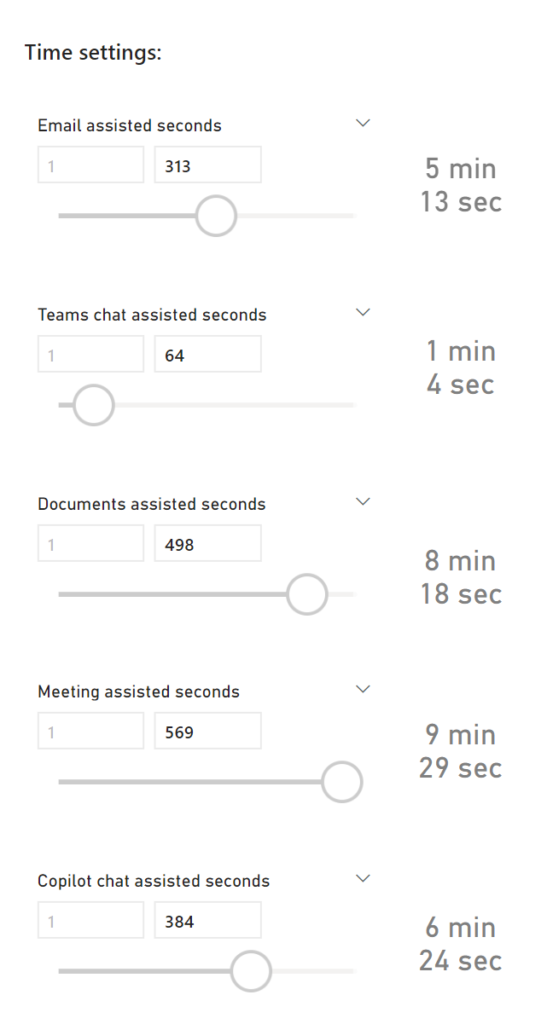
Using the slicers you decide how much time should be calculated as time savings per area. You can fill in a custom value manually or pull the slicer to set a number. The number of minutes and seconds are represented on the side of each graph. Note the title for what the timing is about.
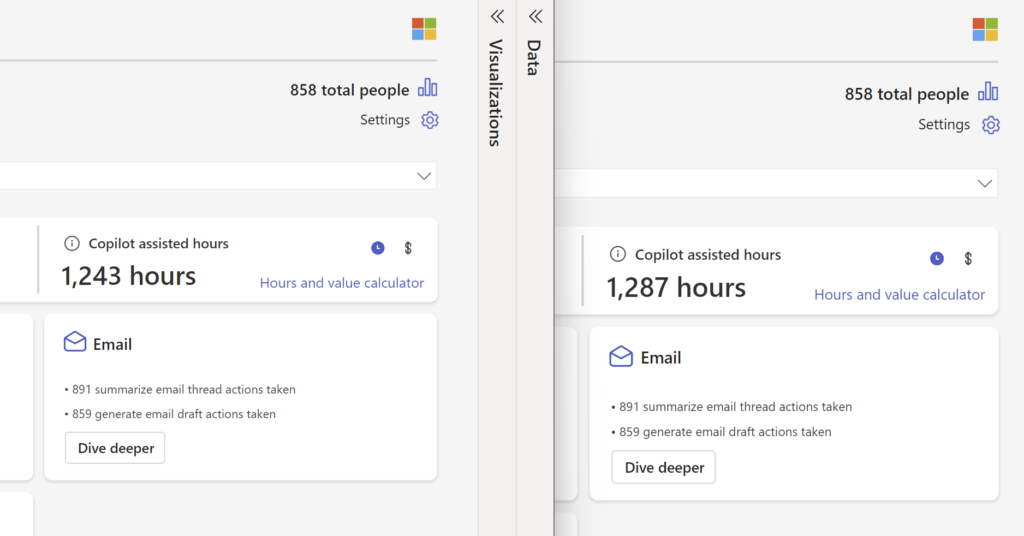
This is the same report and data compared with the settings above to the original (left).
However you set these slicers locally in Power BI Desktop will be the default settings for your users but they can of course change these values inside the report settings page too.
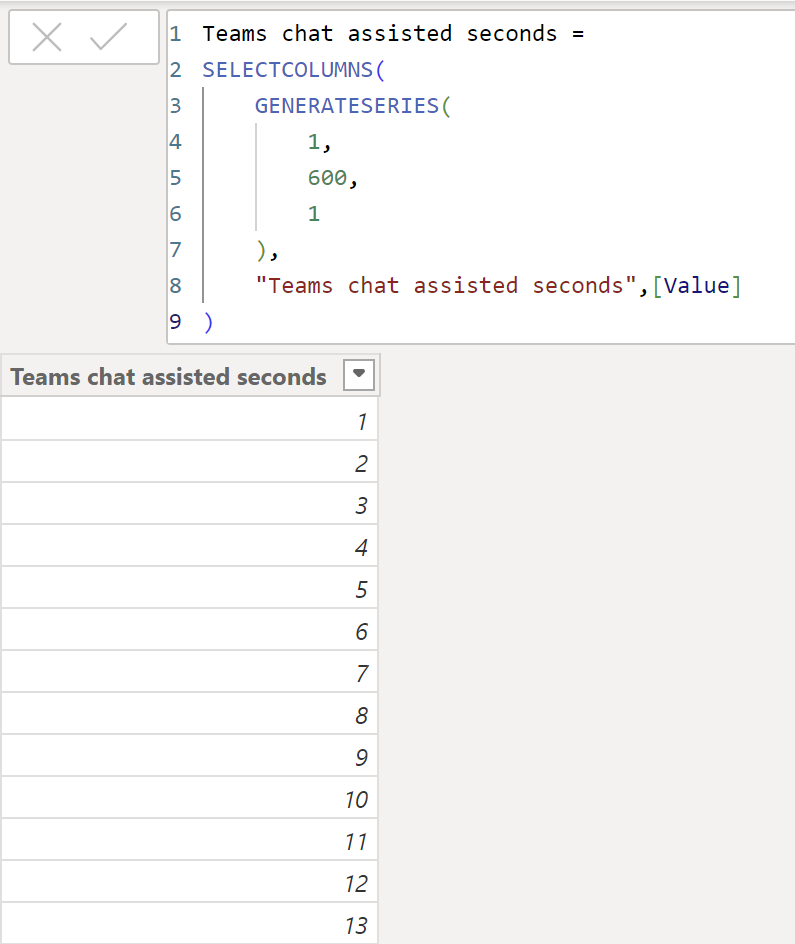
For each of the slicers, there’s a table that is generated like this. If you change 600 on row 5 to another value, this will be the new maximum value available to set in the slicers. They’re currently set to 10 minutes (600 seconds).
Technical under-the-hood information on the template
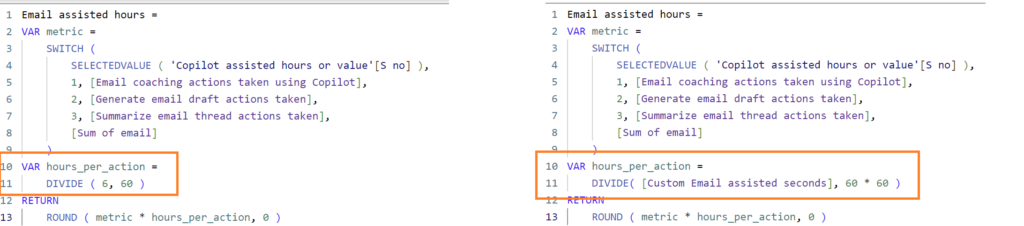
The original report calculates all time by simply dividing 6 by 60 to get 0.1 hours times the number of actions for Email, Teams etc.
I’ve created my own number of seconds as a measure and since it’s now seconds instead of minutes, I multiply 60 by 60 to get the hours.
The report has 5 areas where time is calculated. On the summary page, they’re summed up together.
- Email assisted hours
- Teams chat assisted hours
- Documents assisted hours
- Meeting assisted hours
- Copilot chat assisted hours
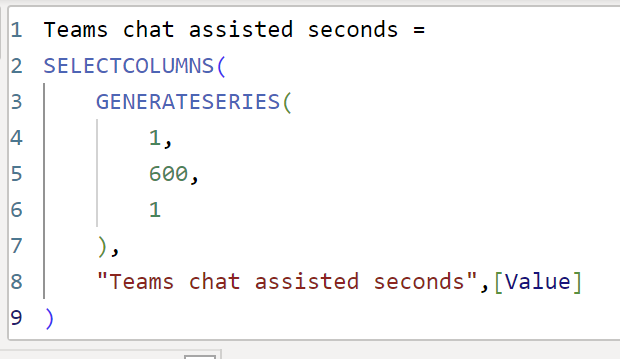
For each of these, I’ve created a virtual table like this:
I then created a new set of measures, 2 for each area.
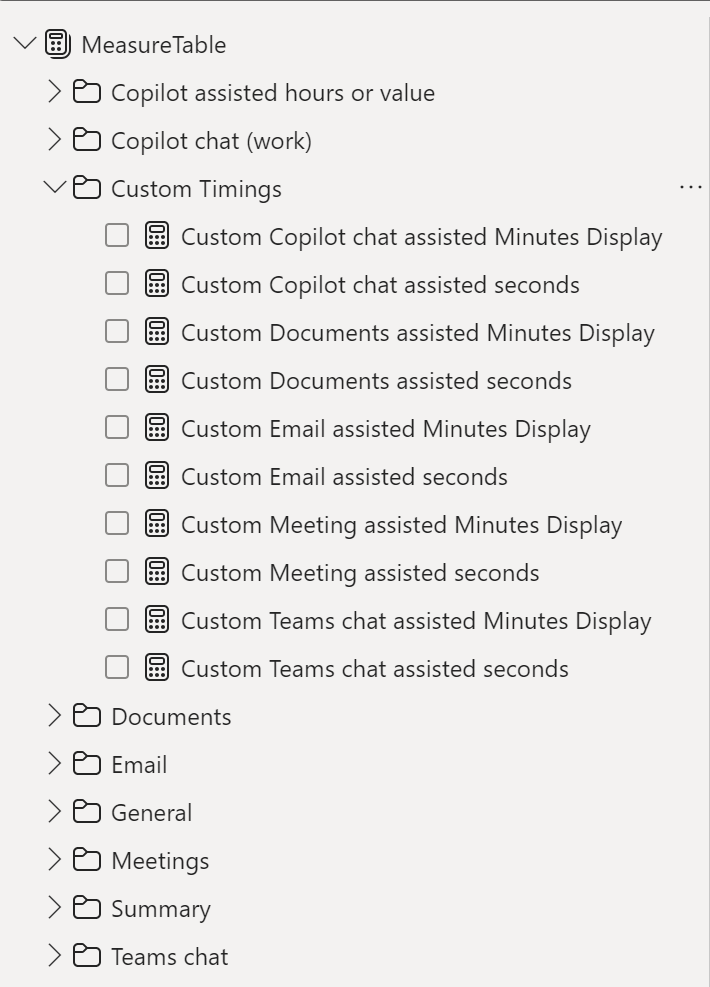
The Seconds is the easiest as it simply get’s the max available value.

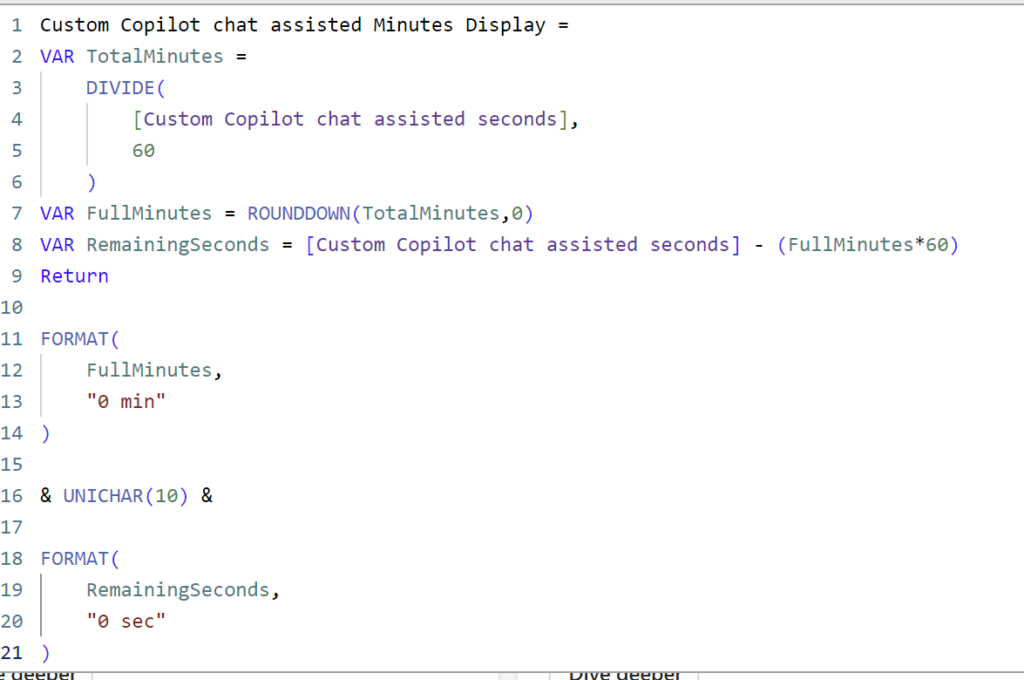
The display measure is only used on the report settings page for a better overview. It looks like this and displays minutes and seconds from the total number of seconds.
The slicers make use of the table fields and the display is a simple Card visual.
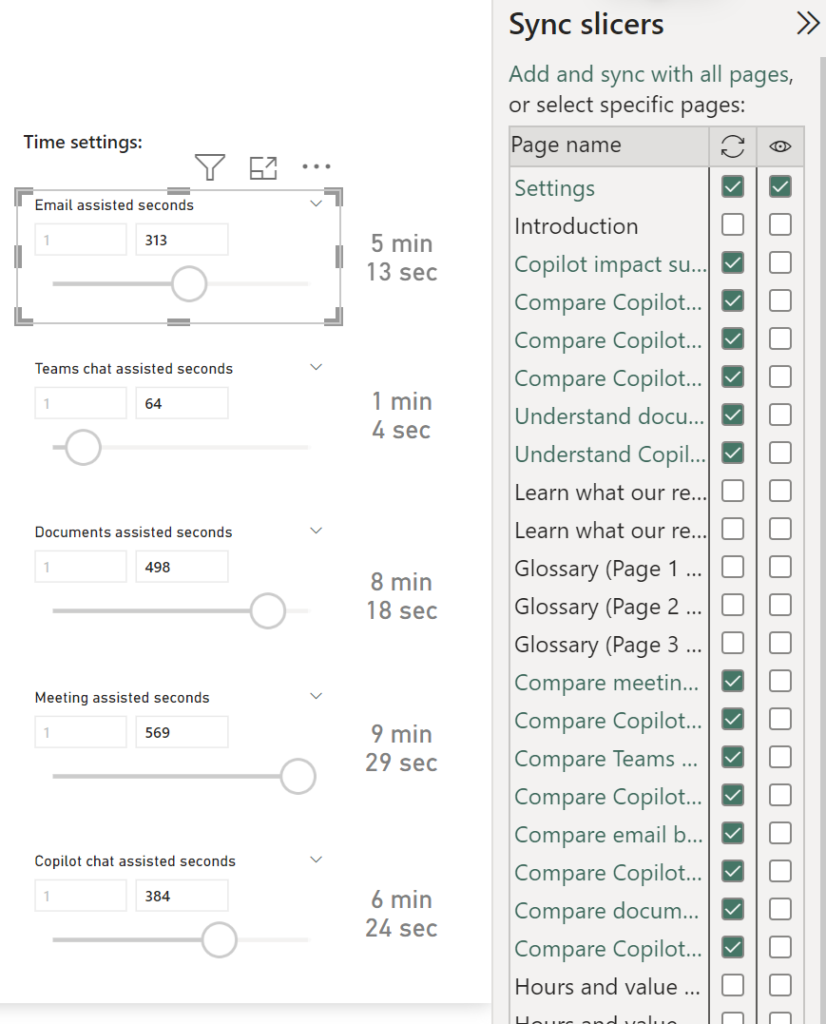
An important step here is that all the slicers are synced to all report pages, just like the other settings on this page! This is what makes it possible to have the slicer on the report settings page but it applies to other pages.
By default, all the slicers are set to 6 minutes, just like the original report. If you change these before publishing the report, your new settings will be the default values in your environment but your end users can of course change this when using the report.
If you have any questions regarding this report, feel free to reach out!
Cheers!