Power BI Template for Chess.com
I recently got pulled into the rabbit hole that is chess and mainly the analytics of it. I’m still a terrible player by all accounts.
As I visioned all things you could potentially do with PGN (Portable Game Notation) data, I realized this type of number crunching might be better suited for Notebooks and Lakehouses in Fabric. Perhaps something I’ll take on in upcoming blog posts? For now – let’s keep it a bit simpler with a Power BI Template 😉
A huge shout out to https://www.chess.com/! The inspirational analytics they have online is amazing and their open API makes this Power BI template so much simpler!
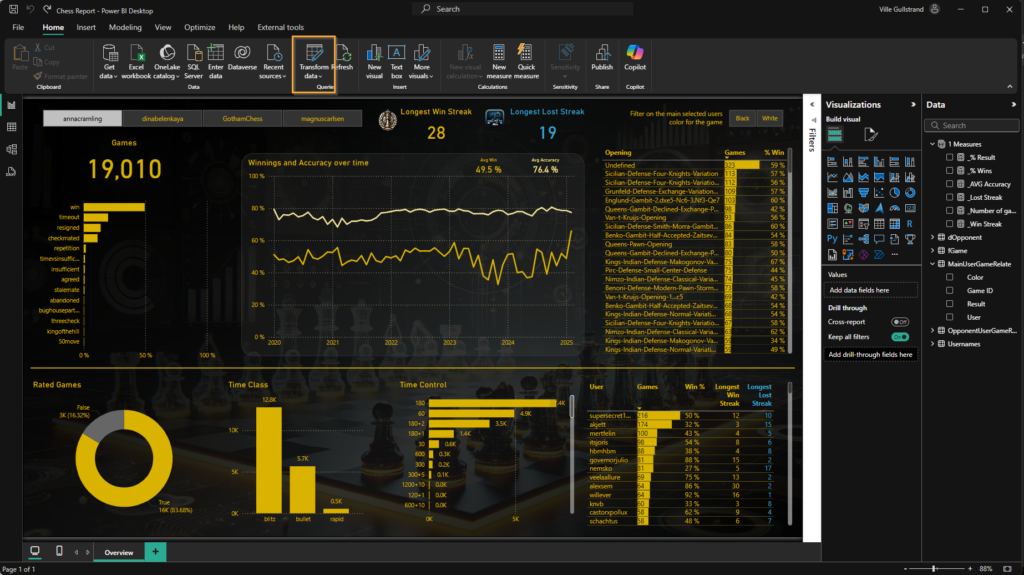
Here’s the overview page I’ve made and you can of course build whatever you want on top of this. Let me know if you expand it and how, I’m always eager to be inspired! Click here to open an interactive version!

OK From here on we’ll divide the post into 2 main sections. Setting it up with your own username(s) and then how to actually use the report and interpret it.
Setting it up with your own usernames
Download the file from GitHub and make sure you have Power BI Desktop installed on your machine.
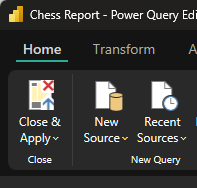
Go into “Transform Data”.
Head over to the “Usernames” list (1), then click on the cogwheel on the “Source” step (2), edit the table to remove the names you don’t want and/or add whatever username you want to analyze data for (3) and finally click on “OK” (4).
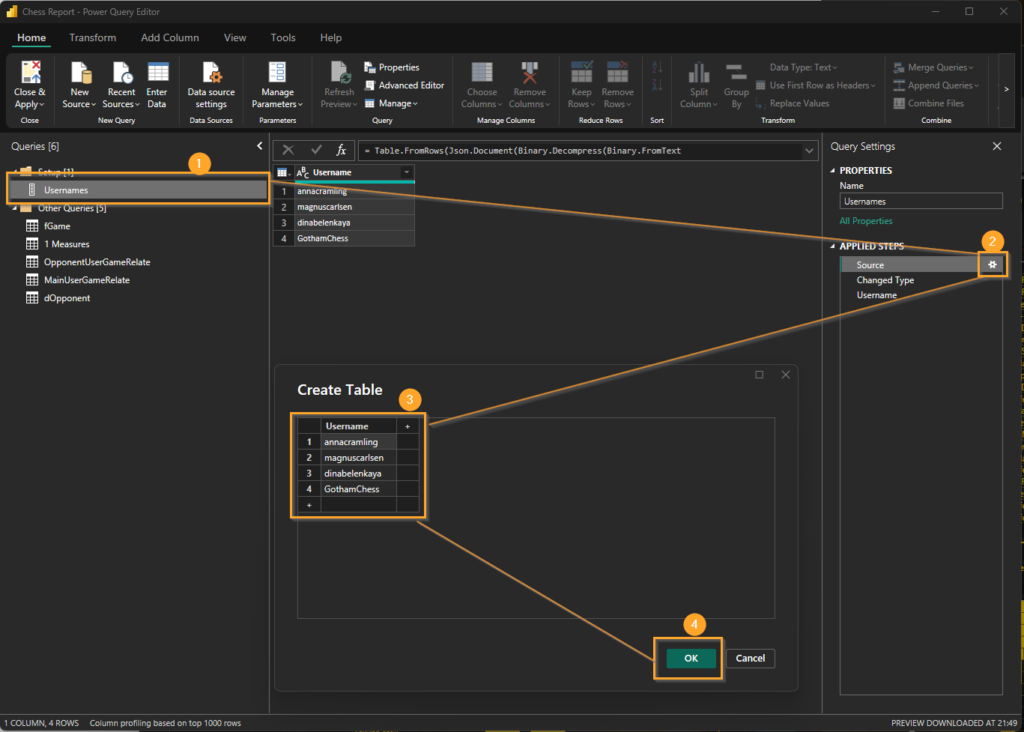
Click on Close and Apply in the upper left corner for the download to begin!
I would advice you to only add one or 2 usernames to begin with just to see how long it takes to download. This template isn’t meant for downloading 50 users data but rather analyzing one at a time.
Using the report

OK starting off simple with the number of games. This is the total number of games fetched for the selected user just above the metric. You can switch between users on that slicer. Whenever you select stuff on the page, this number will reflect the number of games in your selection.
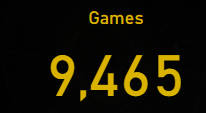
For example you might select “White” in the upper right corner, filtering so that the report only display the games where the selected user played as White.

For Anna, this means 9 465 games out of her total 19 010.
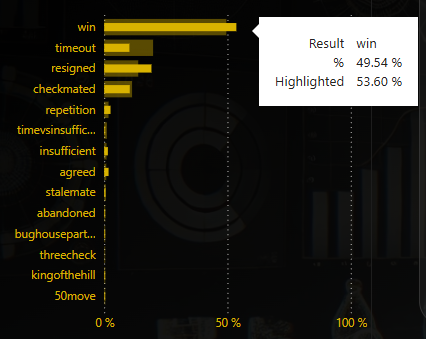
On the far left we have number of games by result in %. Let’s have a look at what happens here when we select something from another visual.
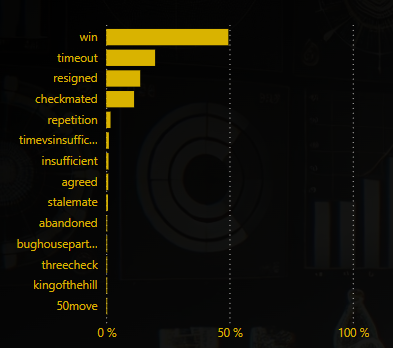
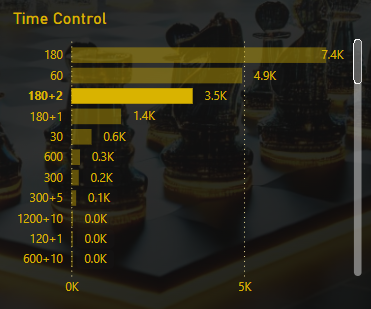
Here, I’ve selected the Time Control 180+2 and for those games (3 513), Anna typically win more often than on the whole average! We can also see that while her second most common result is timeout, in this Time Control category, she resigns more often than get’s timed out.
The Line chart in the middle show average win and accuracy over time. Each data point is a month but if you download the template you can change this down to day level, should you want to.
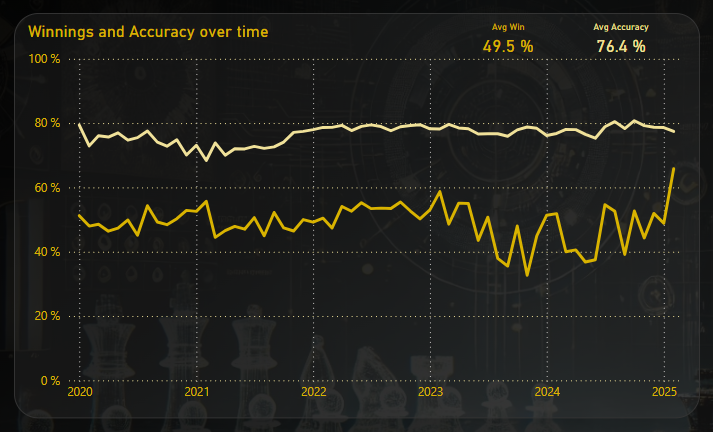
OK so let me show you a neat trick! You can select data points in this line chart by selecting an area!
You might for example select all data between 2 dates or select only those months where the average accuracy was above roughly 77% like this:
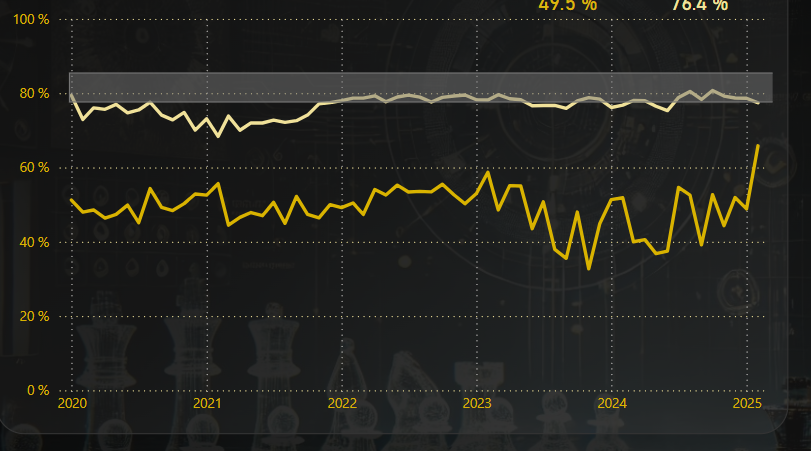
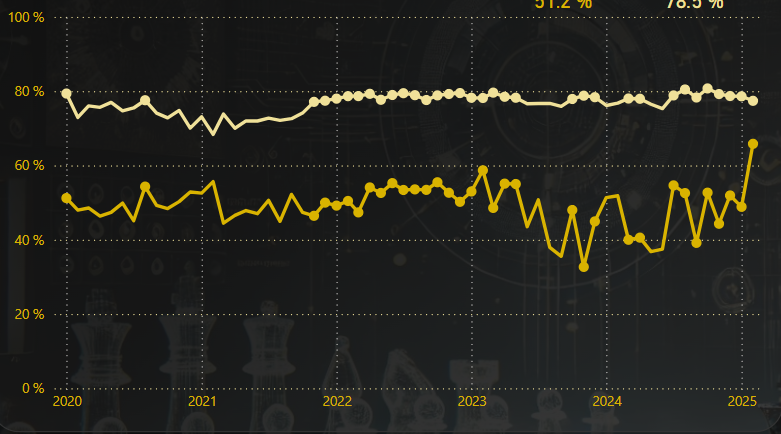
The entire report will now be filtered on only games played in the selected months, which is around 8 800.
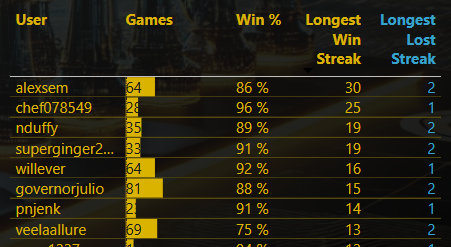
OK now what about these 2 numbers? Well as the names suggests, they show the number of games Anna’s been playing and winning (or losing) at most in a row!

But hey! Hold your horses! If I sort the table on the lower right corner that show the number of games played against opponents, we can see that Anna have won 86% of the 64 games she’s played against alexsem. Most importantly, we find she’s won 30 games in a row at some point! 30 is more than 28, so why wouldn’t the total number on top say 30?
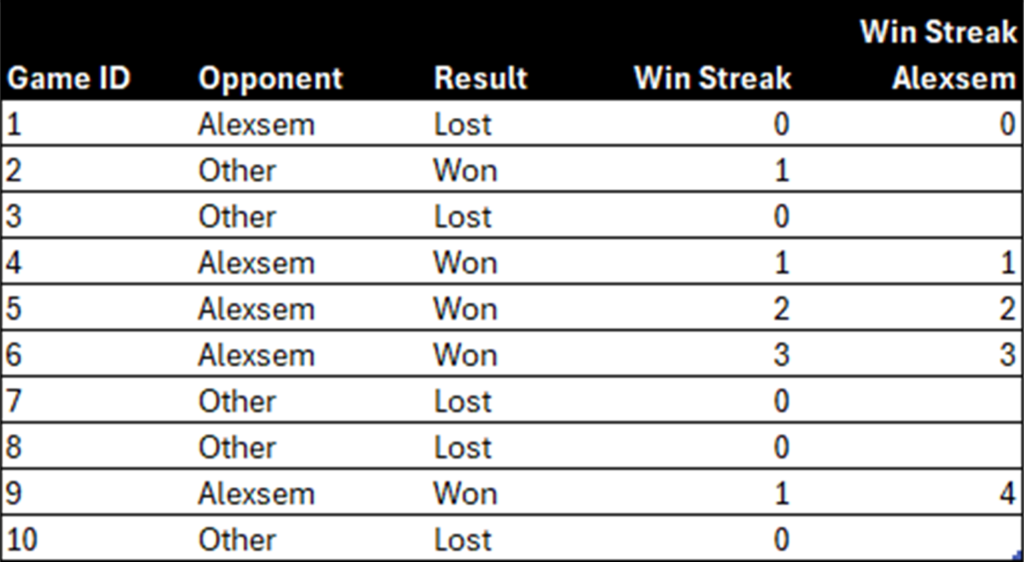
Let’s have a look at a fictional game table. Let’s assume there are 10 games being played, some against Alexsem and some against someone else. If we account for all the games, Anna have won 3 times in a row here at most, before losing a game. If we, however only filter in the games played against Alexsem, she’s won 4 times in a row! This is how the streak number might vary in different contexts.
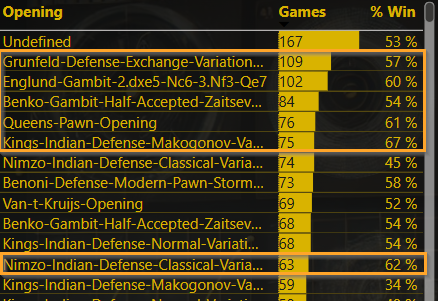
This is recalculated in every context. If we look at Annas games where she played White and only the games with these 3 openings, there’s 295 games played and she won 10 times in a row at some point!
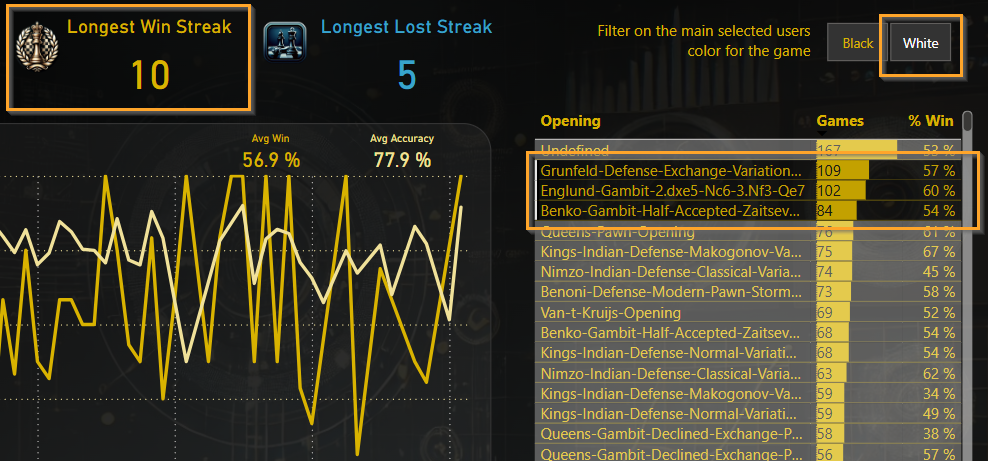
Bear with me here. I don’t have the slightest idea of what these openings mean or how they’re preformed. If we completely disregard what level her opponent were on during the games and only look at the number of games she’s won based on openings, perhaps these openings would be worth using more often. This list is now filtered on games where she played White only, as I’m assuming you cannot dictate opening as black (yes, I’m that bad at Chess so I don’t even know and no, I refuse to just google it).
The 4 people I’ve used as samples in this report can be found here! Thank you for creating more than 60 000 games between the 4 of you for me to analyze and make this report based on 😉
If you have any questions on how to use the template or how anything was made under the hood, feel free to reach out on LinkedIn or in the comments. If you have ideas for building it out further, go for it! No need to ask 😀
Cheers!